Why is this Important?
[smc-hide]Our local economy, environment, and our personal quality of life depend upon a safe, reliable, and efficient transportation system. On a given work day, approximately 527,000 workers commute into, out of, and within San Mateo County, placing tremendous stress on our aging transportation infrastructure. Approximately three out of four county residents drive alone to work. The resulting traffic congestion lengthens commute times, reduces worker productivity, and increases air pollution.
Between now and 2040, the Bay Area is projected to add 2.1 million people and 1.1 million new jobs. This breaks down to an additional 185,000 residents and 100,000 new jobs in San Mateo County. Our roadways lack the capacity to handle the additional traffic this growth will bring unless we shift from the dominant mode of single-occupancy vehicle travel towards alternatives such as taking public transit, carpooling, walking, and biking. Such a transition will not be easy. The average commute time for county residents taking public transit is 45 minutes versus 24 minutes for those driving alone. To move people from single-occupancy car travel, this ratio must be improved and transit must be seen as a more convenient and affordable option than driving a car.
In addition to convenience and the economic incentives for changing our commute patterns, there is the environmental imperative. The transportation sector is the largest source of greenhouse gas emissions (GHG) in California – responsible for 38% of total emissions. Of these emissions, 90% come from on-road vehicles (cars, trucks, buses).
Encouraging Trends
- Plan Bay Area, which grew out of the requirements of California State Assembly Bill (AB) 375, creates the first integrated, regional plan that links transportation, employment, and housing between now and 2040. The Plan rewards cities that build transit-oriented development along transportation corridors within Priority Development Areas (PDAs). Money from Plan Bay Area is beginning to flow to new initiatives that help repair aging infrastructure, support focused growth, and boost freeway and transit efficiency.
- Large employers in the region are playing a growing role in helping their employees get to work ” with buses, shuttles, and even recently, ferries. While some of these corporate buses have created controversy, they are taking cars off of our already congested roads. By the end of 2014, the majority of people employed in the county will be eligible for some form of commuter benefit through the Bay Area Commuter Benefits Program, which requires employers with 50 or more full-time employees to offer one of several commuter benefits options.
- The blending of tech-enabled transportation services and the emerging sharing economy are providing innovative new ways for people to commute more efficiently. Bike sharing, car sharing, vanpools, shuttles, and ride sharing help bridge that critical “last mile” of travel, while new transportation apps provide real-time transit and route planning information.
- In 2011, the average American drove 6% fewer miles per year than in 2004. While some of this decline might be due to the effects of the recession, there is a major shift underway, with the younger generation living a more car-light lifestyle than older Americans. From 2001-2009, vehicle miles traveled for Americans aged 16-34 declined 23%, while passenger-miles on public transit for this age group increased 40%.
- In addition to driving less, Americans are buying more fuel-efficient cars. Vehicle market share of light trucks (pick-up trucks, minivans, and SUVs), which get approximately 40% lower miles per gallon (mpg) than passenger cars, has fallen from 52% in 2004 to 40% now. Over the next decade, new Corporate Average Fuel Efficiency (CAFE) Standards will bring a significant increase in vehicle mileage for light trucks and passenger cars.
- With increased concern over the obesity epidemic, communities across the country are recognizing the positive impact of active transportation – walking, biking, and taking public transit. The resulting efforts to create Complete Streets, which are designed for safe travel by all users (car drivers, bicycle riders, transit passengers, and, pedestrians) and the adoption of Safe Routes to School programs are encouraging more people to walk or bike for short trips.
The convergence of these trends sets the stage for a dramatic shift in how we travel. To accommodate our growing population and economy while protecting our natural resources, preserving our open spaces, and reducing GHG emissions, we will need to integrate our housing, employment, and transportation needs to create transit-friendly communities. When people live near where they work, shop and recreate, they can choose to walk, bike, or take transit and leave their car at home. We also need to provide more new housing for residents of all income levels so that valuable service providers – our school teachers, fire fighters, store clerks, restaurant staff, police officers and others – can afford to both work and live here.
Large-scale changes to our existing infrastructure and transportation networks will not happen overnight. Our current systems are very capital intensive and fragmented, and there is often community opposition towards plans for transit-oriented development and affordable housing in local neighborhoods. Changing where we live, how we commute, and how we develop and grow requires that we take the long-view. Major shifts might not occur immediately, not even for a decade, but we must begin planning for our future now.
[/smc-hide]
What is a Sustainable State?
[smc-hide] In a sustainable state, traffic congestion, air pollution, and greenhouse gas emissions are reduced, existing natural resources and open space are preserved, and people can choose to move from place to place using their car or a variety of transportation alternatives including safe and efficient public transit, walking, biking, and ride-sharing. Total vehicle miles traveled and fuel consumption by cars, vans, and trucks are reduced, and minimum mileage standards for all vehicles continue to rise.[/smc-hide]
[smc-trend-box keytext=1] [smc-trend name=”Environmental Impacts from Transportation” new=1 dir=”none”] [smc-trend name=”Vehicle Miles of Travel and Fuel Consumption” new=1 dir=”none”] [smc-trend name=”Commute Patterns” new=1 dir=”none”] [smc-trend name=”Commute Profiles” new=1 dir=”none”] [smc-trend name=”Congestion” new=1 dir=”down”] [smc-trend name=”Safety” new=1 dir=”up”] [smc-trend name=”Infrastructure” new=1 dir=”down”] [/smc-trend-box]
Environmental Impacts from Transportation

- The transportation sector is the largest source of greenhouse gas (GHG) emissions in California, responsible for nearly twice the emissions as electricity generation.
- The national percentage of GHG emissions from transportation is roughly the same as in California ” 39%.
Cleaning Up Our Act
Nationwide since 1990, six of the major air pollutants from transportation have decreased in spite of an increase in driving over this period. Transportation emissions of carbon monoxide, particulate matter, nitrogen oxide, and volatile organic compounds have all decreased by 50% or more, while sulfur dioxide has decreased by almost 100%. Ammonia emissions grew from 1990-2005, and since then have dropped significantly.
Reducing these emissions has helped clear the skies and improve air quality across the country, but more remains to be done, especially in terms of reducing the impact of climate altering greenhouse gases.
[/smc-box]

- The overwhelming majority of transportation-related GHG emissions in California comes from on-road vehicles (cars, trucks, buses, motorcycles).
- Freight transportation represents one quarter of transportation-related emissions, and its emissions are growing twice as fast as those from passenger modes
Freight-Related Emissions
Trucks, freight trains, and shipping barges are all signs of a buzzing economy, but freight transport in California imposes a significant health and environmental toll on people living along the main transportation corridors. A new study commissioned by the non-partisan California Clean Freight Coalition (CCFC) recommends the following steps for making our freight transport more efficient and less polluting: use electric transportation technologies for local truck trips, move more goods by train and shipping barges, double-stack containers on railcars, and deploy today’s cleanest locomotives (EPA Tier 4).
[/smc-box]
(jump to top of page)
Vehicle Miles of Travel and Fuel Consumption
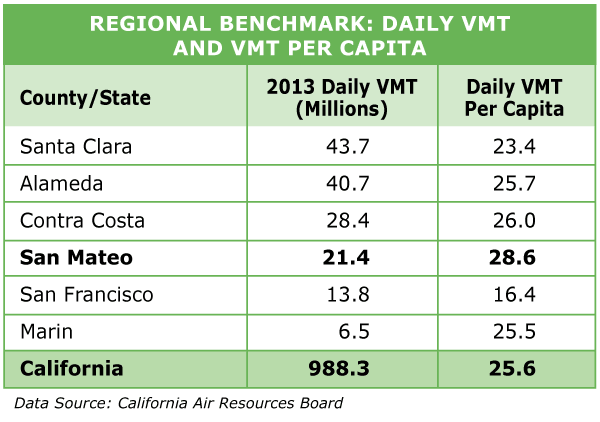
Vehicle Miles Traveled (VMT) is the total number of miles driven by all vehicles in a given time period and geographical area. Factors influencing VMT include population, the state of the economy, personal income, number of registered vehicles per person, and fuel costs. Vehicle Fuel Consumption (VFC) is the total gasoline and diesel fuel usage on all public roads in a given time period, and it is influenced by VMT and fuel efficiency of vehicles.

- Increases in registered vehicles, VMT, and fuel consumption over the last 50 years have far outpaced population growth. Increased fuel efficiency, however, means that the average vehicle today consumes 15% less fuel than in 1960.
- Of the worldwide vehicle stock, the U.S. has one-fifth of the passenger vehicles and 40% of the trucks.
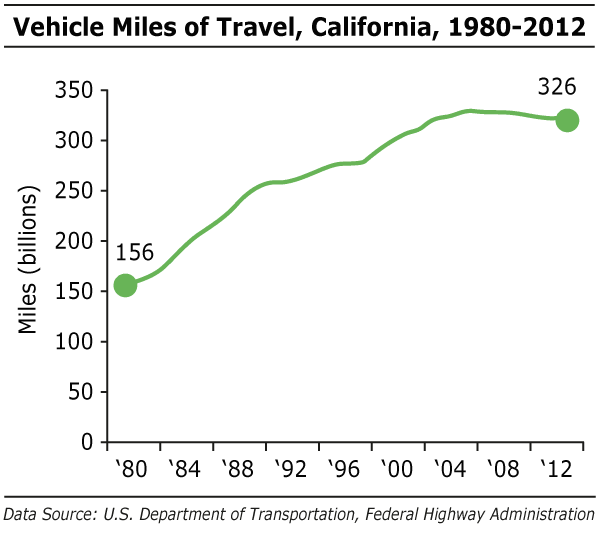
- Historical VMT for California closely mirrors what happened in the United States, with VMT on state roads more than doubling from 1980-2012.
- VMT is strongly correlated with the state of the economy. During the Recession, VMT declined across the country and in the United States, but with economic recovery, it is beginning to rise again.
- In 2013, traffic on state highways was up 2% from the year prior. Monthly totals in 2013 were higher than 2012 in every month except January.

- Per capita VMT in California grew 31% from 1980-2012. After peaking in 2002, it has been on a declining trend.
- Gas prices, adjusted for inflation, doubled from 2002-2012. Despite this rapid increase, 2012 prices were just 18% higher than they were in 1980. In 2013, average gas prices in California were $3.89, down slightly from the year prior.
The Rising Cost of Mobility
For the average American, transportation-related costs are the second largest expenditure after housing. In 2012, annual transportation spending represented 17% of average consumer expenditures (or $8,998), higher than spending on food or healthcare.
Transportation-related consumer spending rose 8.5% in 2012, mostly due to an increase in expenditures on vehicle purchases. In 2012, Americans on average spent $2,549 on gasoline, up nearly 30% from 2010.
[/smc-box]
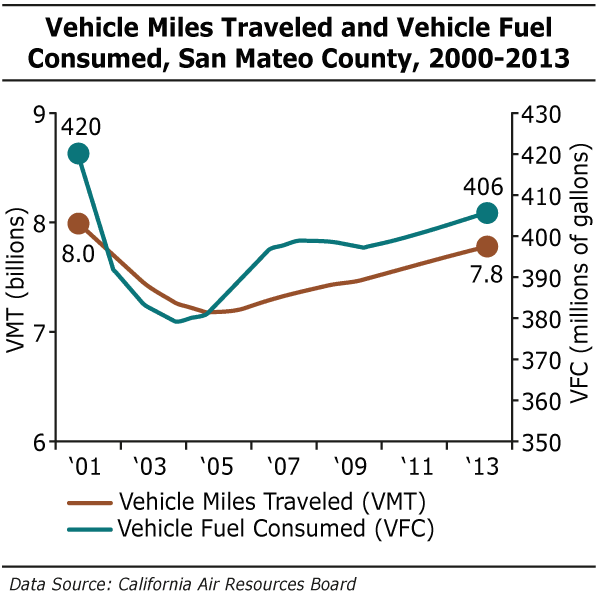
- In 2013, VMT in San Mateo County was 7.8 billion miles, up slightly from the year prior but still 2% lower than in 2000.
- Growth in VMT has been at a slightly higher rate than growth in VFC, suggesting that our vehicle fleet is becoming more fuel efficient.
New CAFE Standards
In 1975, congress established Corporate Average Fuel Economy (CAFE) standards to improve vehicle fuel efficiency. CAFE is the average fuel economy (mpg) of a manufacturer’s fleet of passenger cars and light trucks (pick-up trucks, minivans, and SUVs) sold in the United States. CAFE standards initially helped raise fuel efficiency, but then remained virtually unchanged for nearly three decades.
The Obama administration has made two major updates to CAFE standards. The first phase raises average fuel economy to 38.2 mpg for passenger cars and 28.9 mpg for light trucks manufactured in 2016. The second phase, announced in 2012, raises average fuel economy to 55.3 mpg for passenger cars and 39.3 mpg for light trucks manufactured in 2025. The program also includes manufacturer incentives for electric, plug-in, natural gas, and fuel cell vehicles, along with a special incentive for technologies that help increase fuel economy for large pickups.
[/smc-box]
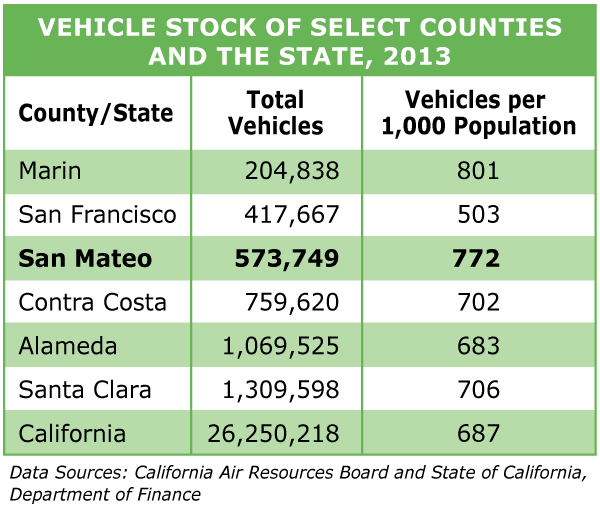
- Since 2000, the number of vehicles in the county has fallen by 2%. Vehicles per 1,000 population in the county is also on a declining trend – 6% lower than in 2000.
- Access to vehicles in the county is high, with only 2% of people reporting they had no access to a vehicle.
International Benchmarks
The United States ranks at the top of the list for number of vehicles per 1,000 population, with a score of 797. Scores for other countries include: Canada 607, Japan 591, Germany 572, Denmark 480, Mexico 275, Chile 184, and China 58.
Unfortunately, we rank at the bottom in another important indicator: fuel efficiency of our vehicle fleet. Of the nine worldwide regions that have fuel economy standards, the United States and Canada have the lowest standards for fleet-average fuel economy.
[/smc-box]
(jump to top of page)
Commute Patterns

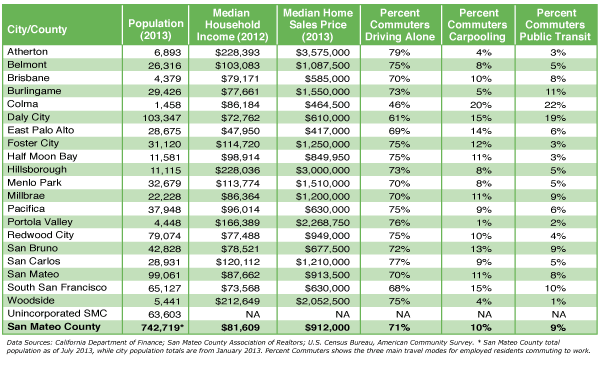
- On a given workday, approximately 527,000 people are commuting into the county, out of the county, and within the county. This figure includes people on all commute modes”whether driving alone, taking transit, carpooling, walking, or biking. Commute travel makes up nearly half of all vehicle travel on an average weekday.
- Much of San Mateo County’s high rate of cross-county commuting can be attributed to our central location between two major employment centers – San Francisco to the north and San Jose to the south. High housing costs are also a factor here as many people working in the county, especially our service providers like teachers, fire fighters, and nurses, are priced out of the area and must commute in from less expensive regions.
- In addition to cross-county commuting, there is also considerable through-county commuting. Approximately 25,000 Santa Clara County residents work in San Francisco, while 24,000 San Francisco residents work in Santa Clara. The majority of these people commute through San Mateo County.

- Only 40% of employed residents in San Mateo County work in the county; 60% commute to other counties for employment.
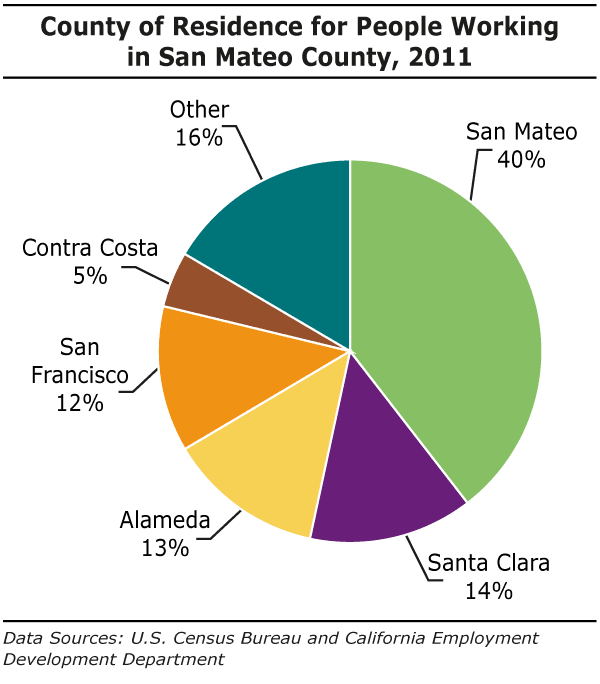
- Approximately 60% of the workers employed in San Mateo County commute in from other counties.
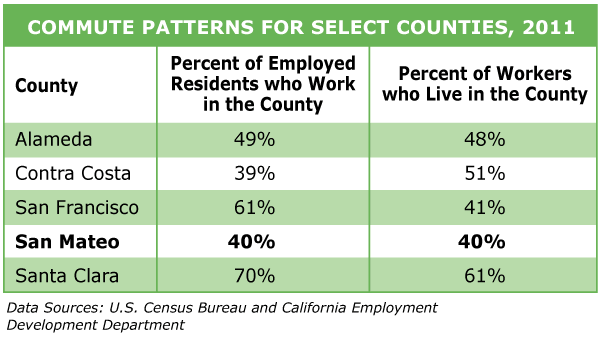
- San Mateo County has some of the highest rates of cross-county commuting of all the neighboring Bay Area counties. In Santa Clara County, by contrast, 70% of employed residents work in the county.

- San Mateo County residents taking public transit to work have considerably longer commutes – 45 minutes compared to 24 minutes for those driving alone.
Commute Profiles
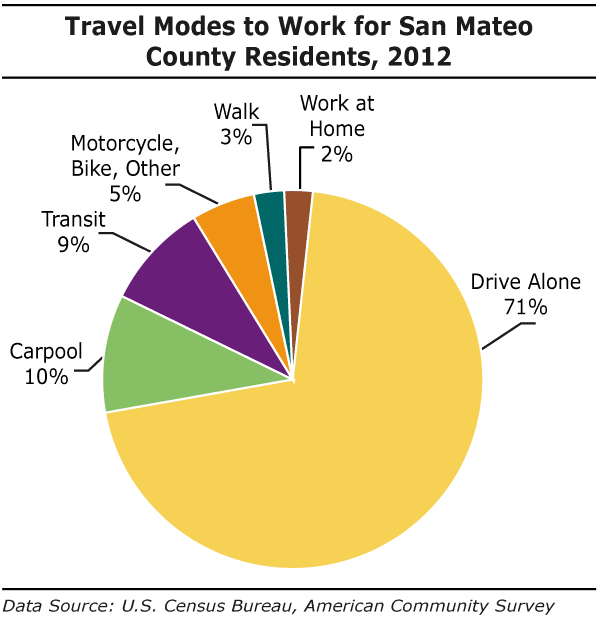
- The percent of commuters driving to work alone is down slightly from 74% the year prior, while the percent taking public transit is slightly up and at its highest point since 2002. Overall, the commuter profile has not seen major change since 2000.

- Compared with the United States, San Mateo County has a larger share of transit commuters and a lower share of those driving alone.
- San Francisco County, with its extensive public transit system and dense development near work, has dramatically different commute modes: only 36% of San Francisco commuters drive alone, while 33% take transit.
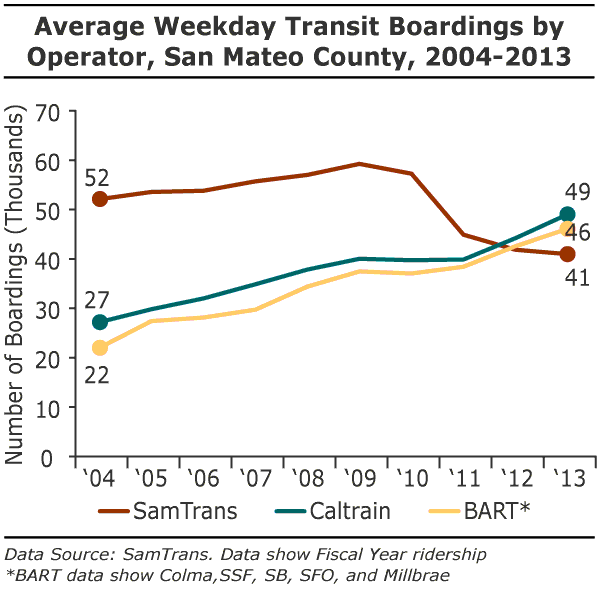
- Caltrain and BART ridership increased significantly (11% and 8% respectively) over the year prior. After a sharp drop off in ridership following the Great Recession, SamTrans boardings leveled off and then increased by the end of 2013.
- Overall, the three major transit systems experienced a 34% increase in boardings from 2004-2013.
Eat Your Veggies… and Ride the Train?
A recent study “The Effect of Light Rail Transit on Body Mass Index and Physical Activity” by John M. McDonald, et al., found an association between light rail use and reductions in Body Mass Index (BMI), with people who used light rail for one year having reduced BMI compared to non-users. The weight loss for light-rail users was equivalent to 6.5 lbs for a 5’5″ person. Light rail users were 81% less likely to become obese over time than the non-users. People taking light rail and other forms of transit have moderate amounts of walking to and from their station stops. Regular, low-impact exercise like walking is extremely beneficial as it’s easy to maintain and has the lowest dropout rate of all the types of workouts.
[/smc-box]
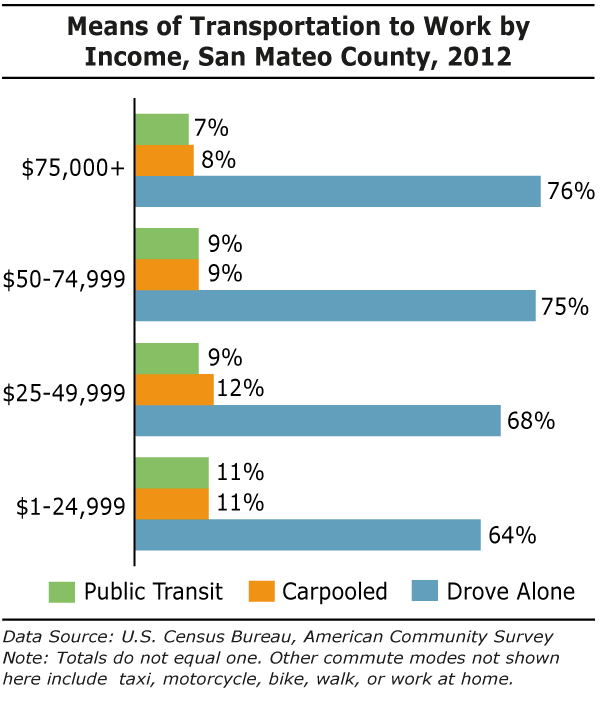
- Residents earning below $50,000 are more likely to carpool and take public transit and less likely to drive alone than those who earn $75,000 or more.
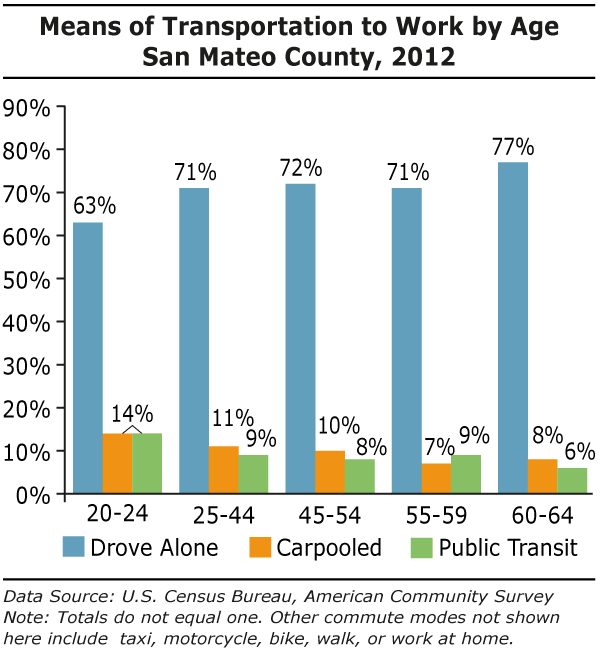
- County residents aged 20-24 are less likely to drive alone to work and more likely to find other modes of transit.
- The 60-64 age group is most likely to drive alone and the least likely to take public transit.
Congestion
Texas A&M Transportation Institute’s annual Urban Mobility Report provides data on traffic congestion in metropolitan areas across the country.
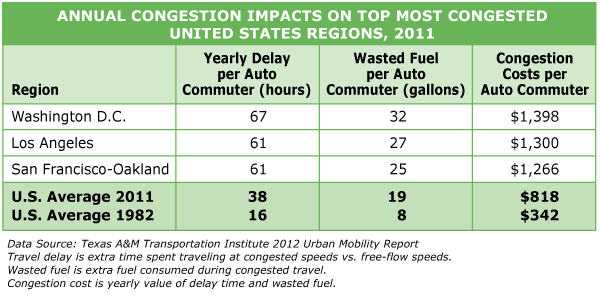
- From 1980-2012, vehicle miles of travel in the country nearly doubled. At the same time, highway capacity (measured in lane-miles) increased only 9%. Insufficient capacity to handle the surge in demand means that congestion in 2012 costs us significantly more in terms of delay and wasted fuel.
- The San-Francisco-Oakland urban area ranks in the top three of congested regions in the country. In 2011, a commuter in the San Francisco-Oakland urban area experienced on average 61 hours of yearly delay due to traffic congestion, up from 24 hours in 1982.
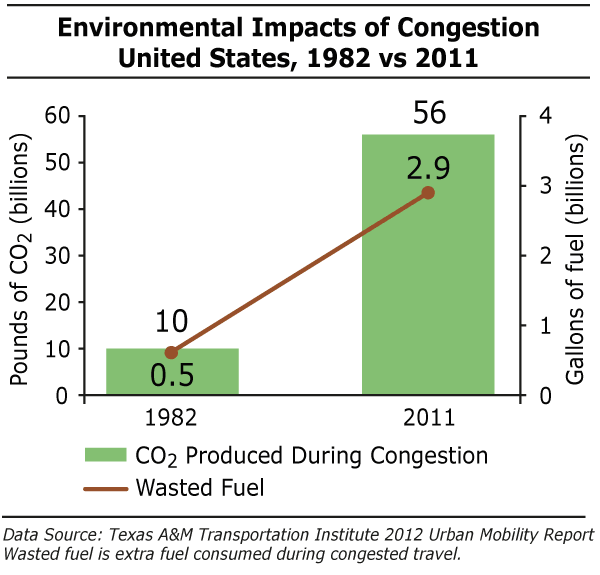
- Not only does congestion cost time and money, there is also a significant and growing environmental impact.
- In the U.S. in 2011, 2.9 billion gallons of fuel were wasted due to congested travel, up from 500 million gallons in 1982. And, 56 billion pounds of CO2 were emitted during congestion.
Managing Our Mobility: Congestion Solutions from Texas A&M’s Transportation Institute
- Increase the efficiency of our current roadways and transportation networks by updating traffic signal timing, rapidly removing crashed vehicles; and improving road and intersection design.
- Expand capacity in critical, high-traffic corridors by adding more lanes, new streets extending public transportation routes, and using larger buses or rail fleets.
- Change usage patterns through flex-work schedules and telecommuting.
- Provide choice of routes and travel modes. Implement congestion pricing and toll lanes where applicable.
- Diversify development by creating more transit-friendly areas with dense development and a mix of jobs/shops/homes so more people can walk, bike, and take public transit.
Safety

- In 2012, there were 38 traffic fatalities in San Mateo County, down 17% from the year prior.
- Of these fatal accidents, 66% were single vehicle crashes, and 55% involved a roadway departure. Speeding was a factor in 39% of fatal crashes, and alcohol-impaired driving (blood alcohol concentration above the legal limit) was a factor in 21%.
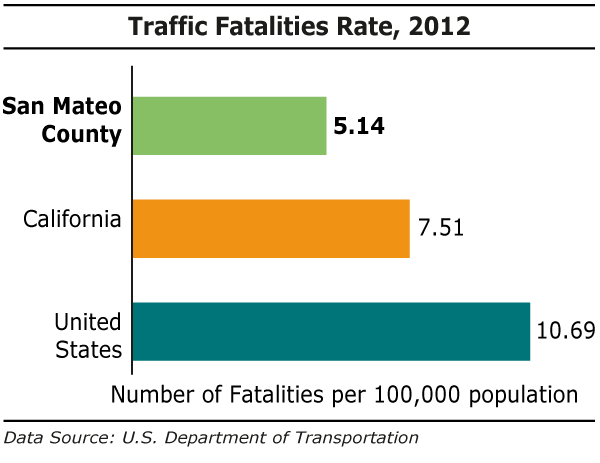
- The county’s traffic fatality rate is well below state and national levels.

- Of traffic fatalities in the county, nearly half are occupants of passenger cars. Pedestrians, however, account for one in five fatalities, a high number given their relatively small numbers compared to automobile drivers.
- The pedestrian and bicycle fatality rates in the county did not see major changes compared to prior years.
National Trends in Transportation Safety
In the United States, transportation fatalities account for one-third of accidental deaths and are the leading cause of death for those aged 5-24. In 2011, transportation-related accidents were responsible for an average of 89 deaths per day and 6,074 daily injuries on our nation’s roads.
In spite of these grim statistics, our roads are getting safer. From 1990-2011, traffic-related fatalities in the U.S. declined 27%, while injuries fell 31%. Occupant protection equipment – seatbelts and children’s car seats”have been a major contributor to the decline in fatalities and injuries. It’s estimated that in 2011 alone, this protective equipment saved 16,566 lives.
[/smc-box]
(jump to top of page)
Infrastructure
Much of California’s transportation system (streets, highways, bridges, transit operations) was built between the 1950s and the early 1970s. Since that time, a growing population, increased vehicle miles traveled, and a surge in freight travel have put considerable stress on this aging infrastructure. The 2012 Report Card for California’s Infrastructure gives the state a C- on Transportation due to poor conditions and insufficient funding and maintenance.
Gas taxes provide the majority of funding for the maintenance and operations of our highways. As cars have become more fuel efficient, these revenues have not kept pace with maintenance needs. The state’s 2014 Five-Year Infrastructure Plan shows that transportation has the most deferred maintenance costs of all the state’s infrastructure – $59 billion out of a total of $64 billion. For more on our infrastructure problems and current plans to address it, please see the Plan Bay Area section.
Pavement Condition Index (PCI). The PCI indicates the state of the roads based on a score of 0-100. Scores in the “fair” category (60-69) indicate that critical maintenance is needed since major repairs can cost five to 10 times more than routine maintenance. The regional benchmark set by the Metropolitan Transportation Commission is a PCI score of 75 or higher.
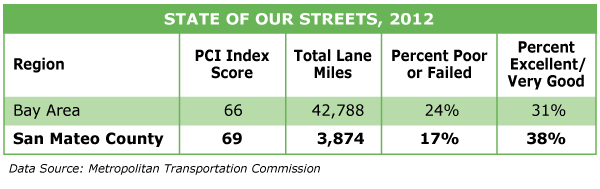
- The state, Bay Area, and San Mateo County all score in the “fair” range on the most recent PCI ratings meaning that critical maintenance is needed now to prevent more costly repairs later.
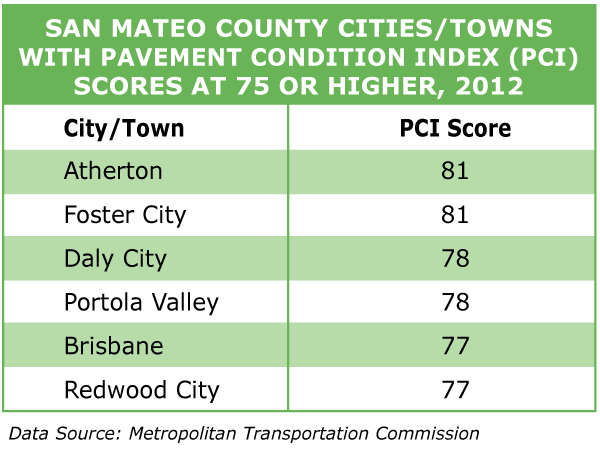
- Cities with PCI Index scores in the “At Risk” category, with scores below 60, are Belmont, East Palo Alto, and Half Moon Bay.
- For PCI Index scores for all the cities in the county, see Transportation at a Glance chart below.
Regional Success Story: El Cerrito
To meet the benchmark PCI Index score of 75 or higher, Bay Area cities with lower scores might want to look to El Cerrito for inspiration. In 2006, El Cerrito’s streets scored a dismal 48 (poor) on the PCI. In 2008, the city passed a half-cent sales tax to finance their street repairs program, and by 2012, their rating had improved to 84 (very good). This year, the city will be recognized by MTC’s Regional Streets and Roads Program for having the most improved pavement in the Bay Area.
[/smc-box]