Why is this Important?
[smc-hide] Over the last 30 years, childhood obesity in the U.S. has increased three-fold, and in 2013, nearly one in three American adults was obese. The obesity epidemic is the greatest public health issue in the country, threatening to overturn decades of gains in life expectancy. Obesity costs our country $150 billion per year, or 10% of our total medical costs, and it is a major contributor to many of the leading causes of death: diabetes, stroke, heart disease, and some forms of cancer.Much of the rise in obesity is due to changes in the built environment and our increasingly sedentary lifestyles. Over the lasts 50 years, communities across the country have become car-centric, designed so that we have to drive to work, to school, to the park, and for errands. As a result, most Americans now spend more time behind the wheel and less time exercising. Currently, only 51% of Americans adults get the recommended 30 minutes a day (5 times per week) of moderate-paced physical activity.
“We need to change our communities into places that strongly support healthy eating and active living.” – Centers for Disease Control
Our country also faces an environmental crisis in the form of rising greenhouse gas (GHG) emissions. The National Climate Assessment, released in May 2014, paints a sobering picture of the impacts of climate change. According to the Report, climate change is not a distant issue, but is something being felt now, with varying effects throughout the country. In California and the Southwestern U.S., the main threats are: reduced snowpack and stream flows, declining agricultural yields, sea level rise for coastal communities, and increased and more severe wildfires.
In California, the transportation sector is the largest source of GHG emissions, responsible for 38% of total emissions, nearly twice as much as electricity generation. The overwhelming majority of transportation-related GHG emissions in California come from on-road vehicles (cars, trucks, buses, motorcycles). Nearly 40% of all trips made in the U.S. are three miles or less, and 17% are less than one mile. Of those trips under a mile, nearly half are taken by car. In many areas it’s simply not safe for people to walk or bike on streets that were designed primarily for automobile use.
“Climate change, once considered an issue for a distant future, has moved firmly into the present.” – 2014 National Climate Change Assessment Report
While obesity and climate change are national and global concerns, part of the solution to both problems lies right beneath our feet – on the streets of our local communities. Cities across the U.S. are taking action to redesign our communities so that we can maintain high levels of mobility while reducing single-occupancy vehicle travel. By getting out of our cars to walk and bike more, we can not only reduce waistlines but also GHG emissions.
[/smc-hide]
What is a Sustainable State?
[smc-hide] In a sustainable state, cities and towns redesign roads to accommodate all users. Connected bicycle and pedestrian routes encourage active transportation and make these viable transportation options for residents. Roads in towns are designed with traffic calming measures to keep speeds low and people safe. Children are able to safely walk and bike to school. New housing is situated near transit stops, allowing for population and economic growth while reducing congestion and GHG emissions. Commuters have numerous options for getting to work – car and van pools, transit, bicycling, telecommuting, and shuttles.[/smc-hide] [smc-box]
Indicators
(click link below to jump to section)
Improving Community Health Through Active Transportation:
• Active Transportation • Complete Streets • Bicycle and Pedestrian Master Plans • Safe Streets • Safe Routes to School
Driving Our Economy: Increasing Prosperity While Decreasing Emissions:
• Commute Travel • Commuter Benefits Programs • Transit-Oriented Development • Alleviating Congestion
[/smc-box]
Improving Community Health Through Active Transportation
Active Transportation
Active transportation is human-powered transport. Skateboarding to school, walking to a transit stop, cycling to work, strolling through a downtown area – all are examples of active transportation. Nearly 40% of all trips made in the U.S. are three miles or less, and 17% are less than one mile. Of those trips under a mile, nearly half are taken by car. Shifting some of these shorter-distance trips to walking and biking can reduce single-occupancy vehicle travel and related GHG emissions.

- The percent of trips in California made by walking, biking, and taking public transit has doubled since 2000. The share of walking trips has increased from 8.4% in 2000 to 16.6% in 2012.
- Approximately 18% of household trips use non-motorized transport.
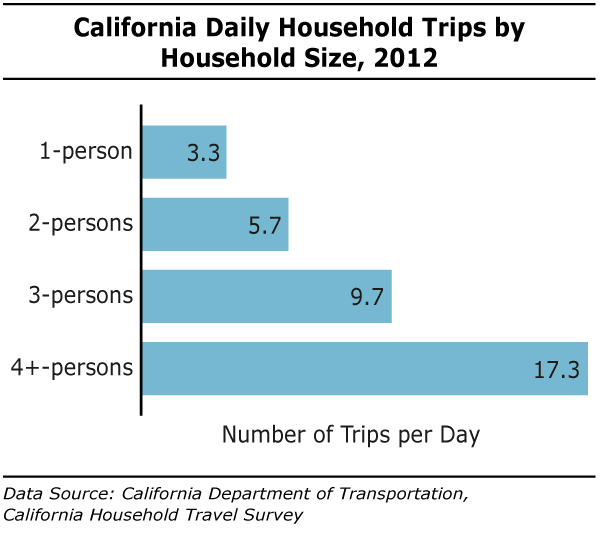
- The average household in California makes 9.2 trips per day (includes all modes of transport). The number of daily trips increases with household size, with households with four or more members making over 17 trips per day.
Complete Streets
Complete Streets are designed to balance safety and convenience for all users”bicyclists, drivers, pedestrians, and transit riders”and may contain features like wide and inviting sidewalks, street furniture and landscaping, bike lanes, bus lanes, comfortable and accessible transit stops, and safe pedestrian and bicycle crossing locations. Complete Streets offer health benefits by encouraging more active forms of transportation like walking and cycling. They also help reduce congestion by improving the efficiency and capacity of roads.
One Bay Area Grants (OBAG), part of Plan Bay Area, will provide $320 million over the next four years ($14.6 billion over 25 years) to support areas that focus housing growth along transit corridors. To be eligible for OBAG funding, a city must have a Complete Streets resolution, which pledges them to take a holistic approach to new transportation projects by making sure that street networks provide safe access for all users.
All of the cities/towns in San Mateo County have a Complete Streets Resolution.
[smc-box]San Carlos’ Eastside Connect
San Carlos’ East Side Connect Project, scheduled for completion in fall 2014, includes increasing the sidewalk width, undergrounding utilities, planting new street trees, and installing decorative streetlights along Old County Road near the Caltrain station. Pedestrian bulb-outs at key intersections will shorten crossing distances for pedestrians and slow vehicle traffic, while bicycle improvements at East San Carlos Avenue and along all of Old County Road will increase access and safety. These more complete and connected streets will make it easier and safer for residents to walk and bike between the east and west sides of town.
[/smc-box]
Bicycle and Pedestrian Master Plans
A Bicycle or Pedestrian Master Plan is a long-range planning document that presents a city’s vision for becoming a bike-friendly or walking-friendly place. Typically these documents spell out how cities will create their bicycle or walking infrastructure – a network of connected routes and trails to move people from homes to jobs, recreation, schools, shopping, and other amenities. These plans are intended to create safe conditions for cycling and walking and to promote both as important transportation modes.
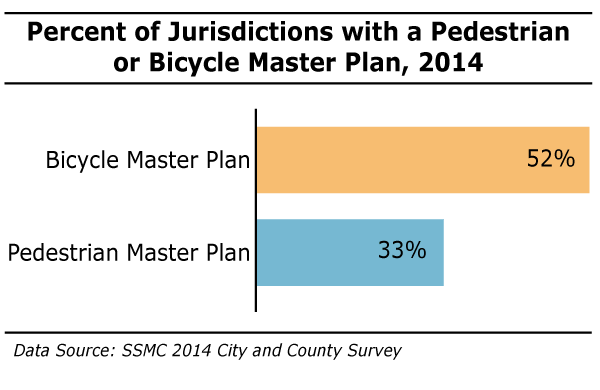
- Over half of the jurisdictions in San Mateo County have a Bicycle Master Plan, while over one in three has a Pedestrian Master Plan.
- For more information on what each city is doing, visit the City Reports page.
A message from Ellen Barton, Active Transportation Coordinator with the City/County Association of Governments and the San Mateo County Transit Authority:
Walking or biking for more of our daily short trips is not only good for the environment – it also helps our economy, health, and community safety. Short trips of less than one mile make up 20 percent of our traffic, so Active Transportation can reduce traffic congestion.The best opportunity for switching to walking or bicycling is to try it for a non-work trip – small shopping errands, going to lunch, getting to the dentist. These non-work trips account for 80 percent of the trips on the road each day. Shifting a few of those to walking benefits everyone. This is not about getting people out of their cars for all trips; it’s about right-sizing, or using the proper tool for the job. When it’s a long trip, use the car. When it’s a short, flat trip, try to walk or use the Bike Share to get where you need to be.
[/smc-box]
(jump to top of page)
Safe Streets
In the United States, transportation fatalities account for one-third of accidental deaths and are the leading cause of death for those aged 5-24. In 2011, transportation-related accidents in the U.S. were responsible for an average of 89 deaths and 6,074 injuries per day. Worldwide, approximately 1.3 million people die each year in traffic-related accidents, making traffic-related accidents the ninth leading cause of death.
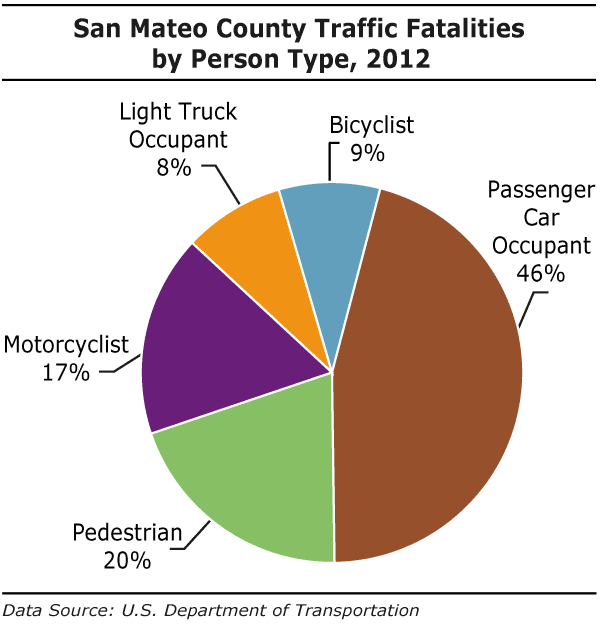
- In 2012, there were 38 traffic-related fatalities in San Mateo County. This equates to a rate of 5.14 fatalities per 100,000 population, significantly below the rates for California (7.51) and the U.S (10.69), but nearly twice as high as the rate in Sweden (2.7). Traffic-related fatalities account for 21% of deaths due to injury in San Mateo County.
- Nearly one in three traffic fatalities in the county in 2009 was a pedestrian or bicyclist. Given this high share of the overall fatality rate and the movement to increase bicycle and pedestrian travel, it’s imperative to improve bicycle and pedestrian safety in key areas of the county.
- Most pedestrian/bicycle collisions in the county occur in urban areas, especially along the El Camino Real Corridor. Bicycle collisions also occur more frequently in Montara and at the intersection of Highway 1 and Highway 92. There is a higher frequency of pedestrian collisions along Mission Street in Daly City.
“We seem to be more tolerant of death when it happens on the roads… No loss of life is acceptable. The road system needs to keep us moving. But it must also be designed to protect us at every turn.” – Sweden’s Vision Zero Initiative, which aims for zero traffic-related deaths.
[smc-box]
Calming our Streets
Our roads have been designed primarily for maximum capacity and speed. The faster a vehicle is traveling, however, the more likely that a crash will cause serious injury or a fatality, especially when pedestrians or bicyclists are involved. As speed increases, a driver’s field of vision is narrowed and breaking time increases. Traffic calming measures are proactive steps and design changes made to reduce vehicle travel speeds. Features that make rural highways safer – wide lanes and shoulders that accommodate driver error and straight roadways – are exactly the opposite of what is needed to make pedestrian areas safer. In pedestrian areas of towns and cities, more narrow roads with gradual curves heighten drivers’ sense of danger, thereby making them slow down and drive more cautiously. Traffic calming measures include: speed humps, raised crosswalks, narrow roadways, roundabouts, and sidewalk bulbouts that shorten pedestrian crossing paths and slow turning traffic.
[/smc-box]
(jump to top of page)
Safe Routes to School
Over the last 30 years there has been a dramatic shift in our country in how children get to school. In 1969, just 12% of students were driven to school; by 2009, close to half of all students were driven to school. As a result, school-related traffic now represents approximately 25% of morning commute travel in our cities and towns. Safe Routes to School (SR2S), a national program with the goal to enable and encourage children to walk or bike to school, is working to reverse this trend. SR2S provides projects, activities, and grant funding to school districts so they can create their own programs to best meet their unique situations. SR2S program elements include: Education, Encouragement, Enforcement, Engineering, and Evaluation
In San Mateo County, the County Office of Education administers SR2S. Since 2011, 100 county schools have participated in the grant program. Funding is from a combination of federal funds distributed through the MTC regional SR2S program and local funds distributed through C/CAG Measure M. 2014 Grants will be awarded June 20th.

- Over the last 30 years, there has been almost a complete reversal in the percentages of children walking and biking versus being driven to school in the United States. Over roughly the same 30-year period, childhood obesity rates in the U.S. have more than tripled, from 5% in 1971 to 17% in 2012.
- Safe Routes to School programs across the country are beginning to make positive impacts, and over the last several years, the percentage of children walking to school has increased. In 2012, 16% of U.S. children and 27% of San Mateo County children were walking to school.
A Link between Exercise and Concentration in School
Mass Experiment 2012, a Danish science project looking for the links between concentration, diet and exercise found that kids who walked or biked to school performed measurably better on tasks that required concentration than their peers who were driven or who took transit. While breakfast and lunch impacted concentration, the effect was not nearly as strong as the impact of exercise.
[/smc-box]
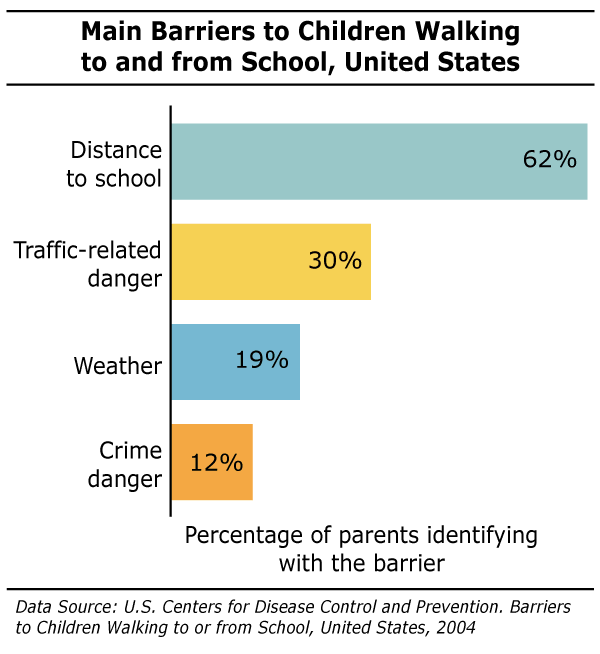
- Distance to school was the most common barrier (62%) cited by parents that prevented their children from walking or biking to school, with traffic-related danger (30%) the next most common.
- Crime danger was a much less common barrier, with just over one in ten parents identifying with this barrier.
The Long Way Home
In 1969, 41% of U.S. children in grades K-8 lived within one mile of school, but by 2009, this number had fallen to 31%. Starting in the 1970s, instead of renovating older schools or building new schools within the community, many districts began building new, larger schools on the edge of town, where land was available and was often much less expensive. Resulting school consolidation means bigger schools with larger school catchment areas, thereby increasing the distance between home and school for many students and often discouraging walking and biking.
[/smc-box]
(jump to top of page)
Driving Our Economy: Increasing Prosperity While Decreasing Emissions
Commute Travel
Commute travel is responsible for approximately one-half of the motor vehicle travel on an average weekday, and 71% of county residents commute alone to work. Between now and 2040, San Mateo County is projected to add 185,000 residents, 100,000 new jobs, and 55,000 new housing units. At the same time, under The Global Warming Solutions Act (AB32), California is tasked with reducing GHG emissions to 1990 levels by 2020 (a 25% reduction). Meeting the needs of a growing economy and population while decreasing emissions requires a shift away from single-occupancy commute travel to alternate modes like transit, telecommuting, carpooling, and cycling.
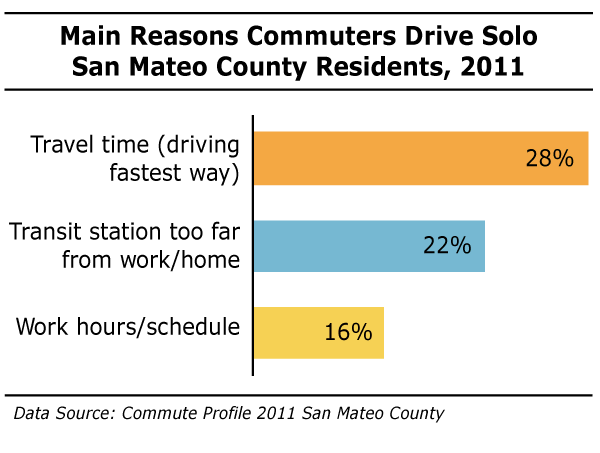
- Convenience and distance to transit station are the two main reasons that solo drivers cite for why they don’t take public transit.
- Of the current solo drivers who say another form of commute is possible for them, 24% say public transit is possible, 21% say carpooling is possible, and 18% say bicycling is possible.
Zimride
The top two reasons that San Mateo County residents gave for not carpooling were that they couldn’t find a carpool/vanpool partner (25%) and that they didn’t like coordinating with others (16%). Zimride, a ridesharing community that connects drivers and passengers traveling on the same route, can help people overcome both these obstacles. People can connect via the Zimride program and even exchange payment for gas online. Zimride typically is set up with college, university, or corporate communities.
[/smc-box]
(jump to top of page)
Commuter Benefits Programs
Increasingly, employers are playing a role in helping their employees switch from solo-vehicle commuting to other modes, whether by offering a free shuttle, a last mile connection shuttle between a transit station and work, a pre-tax benefit for transit or vanpool costs, bike racks and showers, or a transit subsidy. While private employer shuttles run by large companies like Facebook, Genentech, and Visa have generated a lot of controversy, they are helping reduce congestion and transportation-related emissions. In the greater San Francisco/Silicon Valley region, there are an estimated 4,015 weekday passengers using employer-provided shuttles. The use of these shuttles leads to a reduction of approximately 43 million vehicle miles traveled and 8,500 metric tons of GHG emissions annually.
Smaller companies have also begun offering commuter benefits to their employees. Employers realize the importance of helping their employees get to work, and providing a commuter benefit like a pre-tax deduction for transit costs or a transit subsidy is a valuable tool for attracting and retaining talented employees.
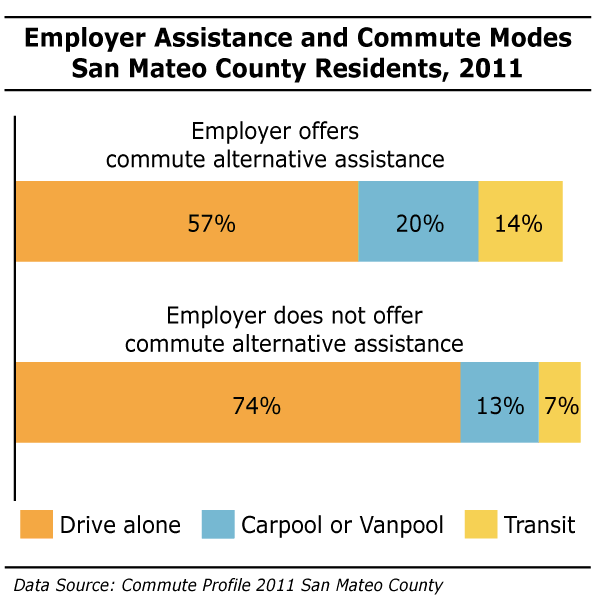
- Employer commute benefit programs can make a difference in moving county residents away from solo commuting. Only 57% of county residents working for employers who offer commute alternative assistance drive solo, versus 74% of residents who work for employers who don’t offer this assistance.
Local Success Story: Amgen
To encourage its South San Francisco staff to switch from single occupancy vehicle commuting, Amgen’s Commuter Program provides incentives for employees using public transit, driving in a car/vanpool, bicycling, walking and telecommuting. When Amgen staff use alternative modes of transportation for at least 60% of their commute and log it into the Ridelinks online tool, they receive a $100 payroll credit.
Additionally, they are guaranteed a free ride home in case of an emergency and can also enroll to receive pre-tax commuter benefits.
Amgen’s South San Francisco Commuter Program participants contribute to reducing Amgen’s carbon footprint and advancing Amgen’s Environmental Sustainability efforts. Since 2011, Amgen staff contributed to the reduction of 1,430 metric tons of GHG emissions, equivalent to the emissions from 3,404,762 miles driven by an average passenger vehicle (EPA Greenhouse Gas Equivalencies Calculator). In 2013, Amgen’s Commuter Program was recognized by Best Workplaces for Commuters for meeting the National Standard of Excellence.
[/smc-box]
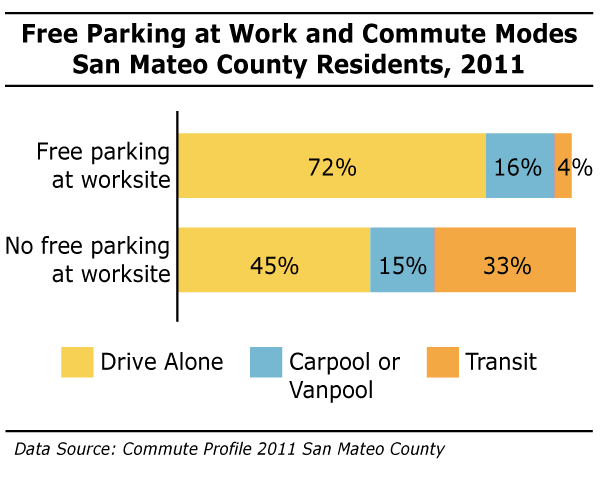
- Availability of free parking at a work-site is strongly associated with the mode of travel for county residents. Only 45% of those who do not have free parking at their work-site drive solo, versus 72% of those who have free parking at their work.
The Bay Area Commuter Benefits Program
The goal of SB 1339, the Bay Area Commuter Benefits Program, is to reduce air pollution and GHG emissions from motor vehicle travel by moving commuters from solo-occupancy vehicle travel to alternatives like transit, vanpool, carpool or bike. The program will go into effect on September 30th, 2014 and operate on a pilot basis in the Bay Area through the end of 2016. If successful, the model might be used in other metropolitan regions of the state.
Under SB 1339, Bay Area employers with 50 or more full-time employees within the Bay Area must offer their employees one (or more) of the following commuter benefit options:
- Option 1: Pre-tax benefit. Employees can exclude transit or vanpool costs from their taxable income, up to the maximum amount allowed under federal law ($130/month). Employees who take advantage of this option could save up to $600 per year. This benefit also reduces employers’ payroll (FICA) taxes, saving them on average $140 a year per employee.
- Option 2: Employer-provided transit/vanpool subsidy. The employer provides a subsidy to cover employee’s transit or vanpool costs up to a maximum of $75/month (employer can provide more if they would like).
- Option 3: Employer-provided transit. The employer provides a free or low cost bus, shuttle, or vanpool. This option can be very costly to employers, but employer-transit can be a valuable way to attract and retain workers.
- Option 4: The employer provides an alternate benefit from a list of options. This option is best for employers located in areas not served by transit. This option provides more flexibility to offer alternative commute options like walking, telecommuting, or switching to electric vehicles.
The Caltrain Go Pass
The GoPass program from Caltrain is one option that companies can use to provide a transit subsidy for their employees. For companies located close to a Caltrain station, this can be a very valuable employee benefit. Employers or residential communities purchase an annual pass good for unlimited rides seven days a week between all Caltrain zones. The total cost of the program is the greater amount of either $165 per eligible employee or resident or $13,750.
2014 Go Pass participants include: the City of Palo Alto, Evernote Corporation, Facebook, and the San Mateo County Transit District. The non-profit housing developer, Mid Pen, is using the Go Pass for residents of its new Bay Meadows Complex in San Mateo.
[/smc-box]
- Encouraging municipal staff to take alternative forms of transportation is one way cities can help reduce GHG emissions and lead by example.
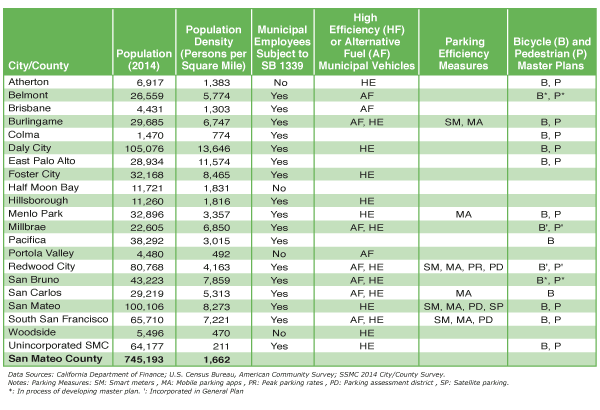
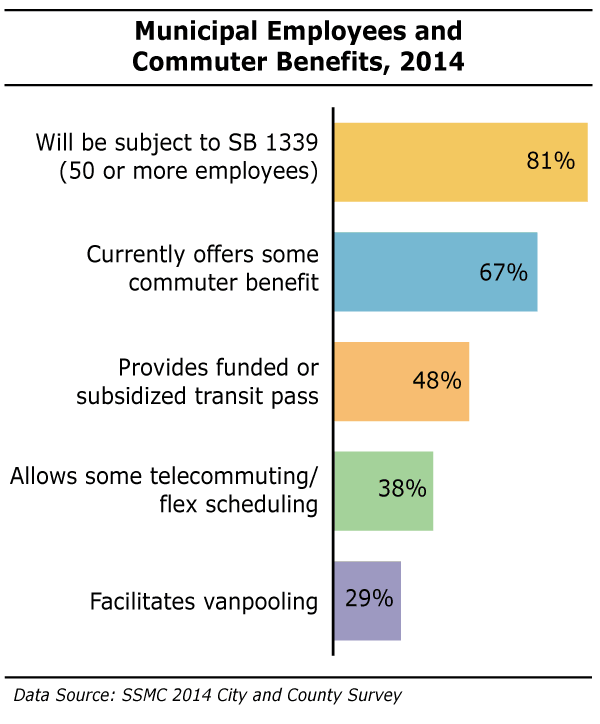
- All but four of the 21 jurisdictions in San Mateo County have 50 or more municipal employees and will therefore be subject to implementing SB 1339 and providing some form of commuter benefit to their employees (beginning September 2014).
- Currently, 67% of jurisdictions provide some form of commuter benefit. The most common benefit (48%) is a funded or subsidized transit pass.
- Many jurisdictions in San Mateo County have made a commitment to reducing GHG emission from their municipal vehicle fleets by switching to high-efficiency vehicles and alternative-fuel vehicles. Sixty-two percent of jurisdictions have some high-efficiency vehicles in their municipal vehicle fleet, while 43% have some alternative fuel vehicles in their fleet
Transit-Oriented Development
The main reasons commuters in the county drive solo are that driving is the fastest option and that the transit station is too far from work or home. Building more housing near transit can solve both those issues. Transit Oriented Development (TOD) aims to create compact, mixed-use, walkable communities in close proximity to public transit. This type of development can reduce car dependency, traffic congestion, and air pollution. With TOD zoning, developers are encouraged to build housing for a variety of income levels including affordable housing, which can help revitalize and diversify neighborhoods.
A recent study by Transform and the California Housing Partnership Corporation compared household vehicle miles traveled, vehicle ownership, and transit use for households living in TOD areas versus non TOD households. The study defined TOD households as homes within ¼ mile of a qualifying rail, ferry station, or bus stop with frequent service. Non TOD homes are anything further than ½ mile away from a transit stop.

- There is a substantial reduction in daily VMT for households in TOD areas versus non TOD households at all income levels. The sharpest reduction was for Low and Extremely Low income level households, while Higher income households had the smallest reduction. Overall, lower income households drive less than higher income households.
- The study also found that vehicle ownership rates for TOD households were at least 30% lower than non-TOD households. Transportation-related costs (mostly made up of cost of vehicle and gas) are the second largest household expenditure, just behind housing costs. In 2012, annual transportation spending in the U.S. represented 17% of average consumer expenditures (or $8,998), higher than spending on food or healthcare. For lower income families, being able to live in TOD housing and not own a car can offer considerable financial relief.
Creating Streets that are Vibrant Public Spaces
Streets are public spaces. In an average city, they comprise 20-30% of the land and represent the biggest holding of public land. They are also the most visited part of cities. Instead of separating us, our streets can become beautiful public gathering spaces. And, when designed properly with permeable pavement and rain gardens, streets can act as ecosystems, capturing and filtering storm water runoff.
The Burlingame Streetscape project, with expected completion by end of summer 2014, enhances an already vibrant downtown. Sidewalks were widened from 10 to 16 feet, which allows for the addition of benches for public seating and spaces for outside dining. To create the wider sidewalks, parking was moved from slanted to parallel, and the street’s two lanes were thinned to a total of 20 feet. Bioswales near crosswalk areas will capture storm water run-off.
[/smc-box]
(jump to top of page)
Alleviating Congestion
Transportation Demand Management (TDM) programs reduce the number of vehicles on roadways and help reduce congestion. TDM measures include efforts to move people away from single occupancy vehicle trips to public transit, carpooling, walking or biking. Common features of TDM programs include shuttles, transit pass discounts, carpool programs, and emergency ride home services.
The Peninsula Traffic Congestion Relief Alliance is the Transportation Demand Management agency for San Mateo County, working with employers, commuters, and public and private partners to “improve our San Mateo County commute.” The Alliance brings employers and property managers together in shuttle consortium groups to provide complimentary shuttles to and from BART, Caltrain, and the South San Francisco Ferry Terminal. In 2012, Alliance run shuttles transported 417,000 riders. The Alliance currently manages 19 shuttles that run in Brisbane, Burlingame, Foster City, Redwood City, San Carlos, San Mateo, and South San Francisco. In addition, the Alliance offers complementary transit programs like the Emergency Ride Home, Vanpool and Carpool Incentive Programs, School Pool, Bicycle Parking and Safety Program, and the Downtown Dasher.

- Nearly half of the jurisdictions in the county have some form of shuttle/van service operating within their city. Commuter shuttle vans provide service from Caltrain and BART stations to nearby employers. Some municipalities have their own city-wide residential shuttles that are available for the public to use for free and to help people get around town without private cars. To read about each city, click here.
- Close to one-third of the jurisdictions in the county have a car share service operating within their city limits. Currently only Redwood City has Bay Area Bike Share stations.
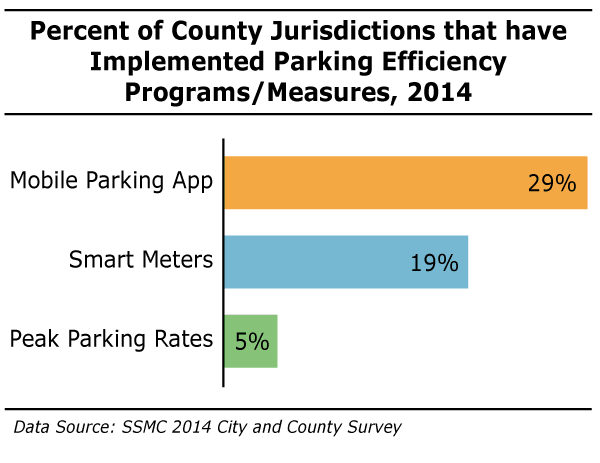
- In larger cities, as much as 30% of traffic in downtown areas can be due to people looking for parking, so measures to improve parking efficiency can reduce traffic congestion. Metered parking and peak parking rates can encourage more people to take alternative forms of transportation (carpooling, walking, biking, transit), especially during peak travel periods.
- Six jurisdictions in the county currently have the mobile App Parker for some of the parking in their downtown areas. Mobile parking apps allows users to find the closest parking space and also to search according to prices. These apps work by having a sensor in a parking space. For cities, the back-end data collection that mobile apps provide lets them gather detailed information on exactly where and when people are parking.
- Burlingame, Redwood City, San Mateo, South San Francisco currently have some smart meters in their downtown areas. Smart meters make payment easier and allow for better tracking by the city to see when and where people are parking.
- Peak parking rates can be implemented when cities have a smart meter system. With data from that and/or a mobile parking app, cities can gauge when parking demand is at its highest and charge accordingly. This brings in added revenue and also can help discourage single-occupancy vehicle trips into downtown areas when they are most crowded. Only Redwood City currently has peak parking rates.
Cities at a Glance (download pdf of table)