
Each year, Sustainable San Mateo County works with a select group of Mills High School students to teach them about sustainability indicators. This year, the students researched Income Inequality, the 2013 Key Indicator. After learning about important trends at the national, state, and local level, the students chose research projects to further explore the topic. Two students visited a local food bank to see how food scarcity impacts residents of our county. Another group examined the growing role that education foundations are playing to raise school funding levels and provide extra services to students. And, two students examined the inequity cycle by surveying students at a local high school to see how their family income levels and education attainment of parents impacted students plans for attending college.
The Mills 2014 Indicators Projects add an important voice to the sustainability discussion and the growing issue of income inequality.
[smc-box] • U.S. and Finnish Education Systems: A Comparison• Food Security
• The Role of Education Foundations
• The Inequality Cycle
• Income Inequality by Race
• The California Homes and Jobs Act
• Comparing California’s Poverty Measure to the U.S. Official Poverty Measure
[/smc-box]
U.S. and Finnish Education Systems: A Comparison
By: Natasha Hui
It is no secret that the United States as a nation lags behind many developed nations in terms of education. Some may argue that our country does not invest enough funds to improve educational institutions. When compared with other countries, however, the U.S. is one of the leading spenders. On average, the U.S. spends approximately $14,000 per pupil, while Finland spends around $8,000 per pupil (OECD).
In this case, unfortunately, test scores and higher funds do not correlate. Finland has gradually traveled up the ranks and is currently one of the leading countries in terms of national test scores. This is evident in the results of the 2012 Program for International Student Assessment (PISA) exams, a two-hour test that is taken by 15-year old students in the participating nations. According to the data below, Finland’s mean test scores surpass the United States average in each of the three subjects.

There are many factors that contribute to the difference, but the majority of influences cannot change easily. For instance, Finland has a more homogenized population compared to the U.S. Finnish citizens receive similar opportunities, which contribute to lower levels of income inequality. Most importantly, students who are taught by a knowledgeable, dedicated instructor stand a better chance of succeeding.
One of the most important factors of Finnish students’ success is well-trained instructors who are passionate about their career. In Finland, teachers are highly respected, matching the reputation of doctors and lawyers. In fact, high school students view teaching as one of the most desirable professions. Although the process of becoming a teacher is arduous, candidates view the opportunity to inspire future generations of students as worth the effort. The Finns do not sacrifice quality when selecting potential educators for their schools. In the U.S, there are 1,500 different pathways of training with varying degrees of effectiveness (Strauss). By contrast, there is only one type of teaching program in Finland, which is completed in any one of the nation’s research universities. No shortcuts can be taken, and as a result, candidates fulfill the same fundamental requirements regardless of location. When considering candidates for these competitive programs, committees first examine each individual’s extracurricular activities and exam scores. Those who pass the entry phase take a test on the study of the teaching profession itself. The next phase involves teaching in a simulated classroom setting, where supervisors observe each candidate’s social skills and ability to conduct a classroom. In the last phase, the candidates are interviewed about their reasons for wanting to enter the profession. To put this selectivity into perspective, out of a group of ten potential primary school teachers, only one is chosen (Sahlberg 2). Because so many aspire to become instructors, only the brightest, most passionate students qualify. These students then undergo years of standardized training to prepare them for classroom instruction.
Finland requires that all primary and secondary school teachers earn a master’s degree. Primary school teachers major in education, while upper-level instructors earn their degree in a specific subject area. Finland uses the European Credit Transfer and Accumulation System (ECTS) for allocating credits; each credit equates to 25-30 hours of work. Students must complete 180 ECTS credits to earn a bachelor’s degree, while an additional 120 ECTS credits are necessary to earn a master’s degree (Sahlberg 3). In total, the training process takes a minimum of five years to complete; those who pursue higher degrees require additional years of training. For instructors who want to teach a specific subject such as English or physics, additional subject-related programs are completed along with the master’s degree. At the end of the program, all students complete a thesis highlighting their findings. The thesis consists of independent research, supervised classroom instruction, and a final presentation relating to their major. In spite of the extensive training, Finnish teachers spend less time teaching in the classroom than those in other nations. To compare, a middle school teacher in the U.S. spends an average of 1,080 hours teaching annually, whereas a Finnish teacher at the same level teaches for 600 hours (Sahlberg 7). Teachers spend the remaining time collaborating with other instructors and members of the country’s Department of Education, where the focus is on the students. During these meetings, they discuss various methods of improving the curriculum, forms of instruction, and the school environment as a whole. Each school works individually with the department members in order to develop lesson plans to maximize student potential.
In a system where individual abilities are nurtured, standardized testing is a miniscule part of the curriculum. Unlike the U.S., where students are required to take one or more standardized tests a year, Finnish students only take one exam prior to entering a university. The Finns do not utilize standardized testing for several reasons. Because teachers dedicate years toward pedagogical studies, they carry the responsibility of monitoring their student’s development, not the government. Government involvement is reduced, which gives teachers creative freedom when educating their students. Without the burdens of the tests, students receive individualized attention from their instructors. In societies where high scores result in more government funding, low test scores may prompt teachers to inflate or discard the worst scores. This form of fabrication gives an inaccurate representation of students who are already subject to a flawed measure of assessment. According to Timo Heikkinen, a Helsinki principal with over two decades of experience in the field, teachers “miss the human aspect” of an individual if they focus solely on national exam scores (Hancock). With this statement, he acknowledges that a number by itself does not accurately portray the attributes of the individual. Each person learns at his or own pace; each harbors his or her own personal talents. Heikkinen also states how most Finnish teachers would resign if they were forced to adopt a curriculum centered on preparing for tests. Well-trained instructors become aware of these differences and adjust their teaching methods accordingly in order to help their students succeed.
Another factor that influences the student success levels in Finland is evident in the average school day. In the U.S., children begin formal education as early as age three. On the other hand, Finnish children do not begin school until age seven. This allows them to enjoy their early childhood years without worrying about school work, as this period is crucial for developing social skills and a sense of well-being. Homework is frowned upon in the early years of education, as “it is seen as a violation of children’s rights to be children” (Anderson). Most of the necessary instruction is taught during school, and homework is limited to less than an hour per day. The main goal of Finnish education is to teach a variety of subjects while allowing students time to nurture their interests. Less homework equates to more time dedicated toward personal development.
To compare the American and Finnish systems in more detail, the typical school days of two primary schools will be examined: Meadows Elementary School (Millbrae, CA) and the Aurora School (Espoo, Finland).
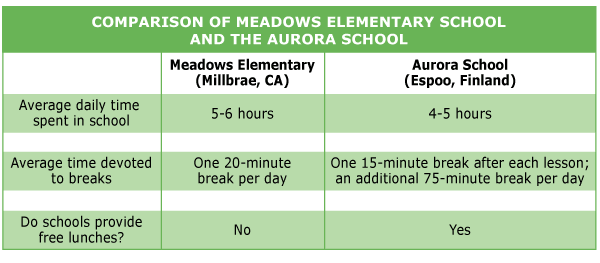
Meadows students spend an average of 5-6 hours in school, while the Aurora students spend 4-5 hours in class. Although each instructor from these schools teaches multiple subjects to students, different subjects are emphasized. Meadows teachers allocate the majority of class time toward the “core” subjects such as math, science, and English. Art and music programs, which are offered after school, are separate from the standard curriculum. At Aurora, students take an average of four 45-minute classes per day, some of which consist of sports, music, and art. Excluding lunch, the Meadows students are given one break for the day, whereas Finnish students receive a 15-minute break between lessons. In addition, they also receive a daily 75-minute recess to use for hobbies, exercise, relaxation, and other activities. Finnish schools provide hot lunches free of charge, but the American students must pay for their own lunches. Lastly, Meadows, like the majority of American schools, use annual standardized tests to measure their students’ development; the Aurora School does not. These comparisons reveal that Finns encourage personal growth among children. The long recess does not limit activities; children choose what they want to do with the given time, which allows them to pursue their own interests. Even with shorter school days and minimal testing, the acknowledgment of individual merit by administrators heavily contributes to the nation’s academic prestige.
Ultimately, Finland’s success stems from involved instructors who encourage students to excel. As a nation, how can the U.S. implement some of the strategies that have propelled Finland to the top? First, a common curriculum can be established for aspiring teachers, which would subsequently produce teachers with similar qualifications. In addition, cutting the number of standardized tests would permit instructors to personalize their teaching methods in order to benefit their students. This way, the time that students spend preparing for tests can be devoted to personal activities. Teachers and individual schools should be given the task of gauging student performance. Even a single change can make the learning process more enjoyable for all parties, and as the new generation enters the work force, quality education should not be neglected.
(jump to top of page)
Food Security
By: Willis Kwong and Elijah Mendel
Food insecurity continues to menace parts of the United States. Not all people have the income to sustain themselves with food, a home, and energy, but fortunately there are other ways that food resources can be distributed. Institutions like food banks and charity groups provide for those who cannot afford to have a meal on the table every day. Ensuring that lower income families have their basic needs met is a prerequisite for creating an equitable society.
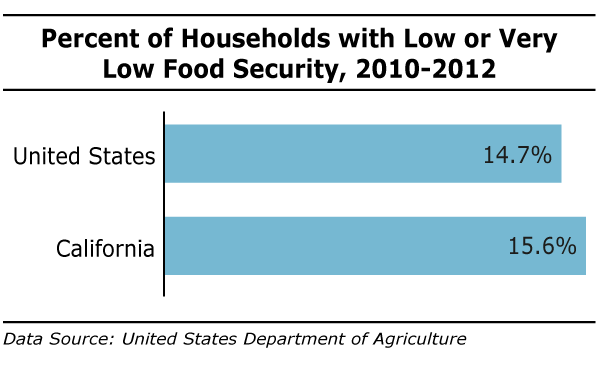
According to research conducted by the United States Department of Agriculture (USDA), 14.5% of households in the U.S in 2012 were food insecure for at least some time during the year, with 8.8 % and 5.7% households falling under low and very low food security respectively. This equals 49 million Americans living in food insecure households, of which 8.3 million were children. California is one of twelve states possessing a food insecurity percentage above the national average.
Food banks are one of the many services that work to resolve food insecurity issues in San Mateo County. Second Harvest Food Bank is one of the largest distributors of food in the country. It collects donations for redistribution to other partners, soup kitchens, or even other food banks. Food from Second Harvest is also distributed at churches, schools, banks, and even by truck. One of the main transports goes through El Granada, using trucks with roll-up sides. Direct service by the Partners in Need Program serves about 2,500 people per week. In San Mateo and Santa Clara counties, about 250,000 people are served food every month that includes fresh fruit, vegetables, rice, beans, cereal, and ground-up turkey or chicken.
Second Harvest also provides its own set of food stamps. It comes in the form of the CalFresh program, which lets people use EBT debit cards at grocery stores to buy food. People who live alone can receive about $200 dollars a month, families of four can receive about $668, and families of six can receive about $952 (CalFresh [Food Stamps] Outreach).
Cal Fresh EBT debit cards are usually available to low-income families and individuals. Undocumented immigrants cannot apply, but their children or other family members who are citizens may apply for the card. Not everyone is well-informed about food stamps or CalFresh, which results in our community missing out on more than $200 million per year due to low participation (CalFresh [Food Stamps] Outreach).
Current studies report an increase in poverty levels in San Mateo County. According to the findings of Beth Mattingly, a Stanford University researcher, approximately 18% of our county’s residents live in poverty, a figure three times higher than the federal poverty rate (Cherney). In other words, 136,033 people live below subsistence levels. Accompanying the increasing poverty levels in our county is the increase in food insecurity levels. Compared to the previous year, there has been a 6% increase in aid recipients from Second Harvest. In 2012, approximately 76,000 people (35,000 of which are children) reported to have used their services.
Despite the efforts of groups like Second Harvest to increase distribution, the problem of food insecurity still persists. At first glance, the 40 million meals provided annually in San Mateo County through food stamps and other charitable organizations might seem like a staggering amount, but in reality this number encompasses only a mere fraction of the hungry mouths in our county: Only 46 percent of the total number of needed meals to feed the food insecure in our county were supplied, while the other 54 percent or an estimated 47 million meals remain missing.
With the federal government’s slew of budget cuts earlier this year, these numbers will likely drop further. On February 7th, President Obama signed the Farm Bill, which will cut $800 million dollars in federal funding for food stamps per year over a course of ten years. With food stamps constituting about 44% of the 40 million food assistance meals supplied in San Mateo County and over half of the meals supplied in Santa Clara County, these cuts will impede efforts by organizations and charity groups to reduce food insecurity levels. Furthermore, this budget cut threatens to dissolve other food programs for the poor, such as the state’s Low-Income Heating Assistance Program or LIHEAP. LIHEAP, a subsidiary program under the Supplemental Nutrition Assistance Program or SNAP, provides low-income households with subsidies to pay for utility bills and food. The dissolution of programs like LIHEAP will force families to trade off between food and other necessities, which as a consequence will increase food insecurity rates.
New solutions are needed to combat the increase in poverty and food insecurity in our society. Distribution of foods by food banks, food stamp programs such as CalFresh, and even Social Security provisions have received budget cuts which, in turn, will likely reverse the progress we have already made. Low registration for food stamps also remains a problem. If not enough people register, millions of dollars in available resources are wasted and people don’t get the help they need. It is time to develop a more effective solution to the issue.
(photos)
(jump to top of page)
The Role of Education Foundations
By: Noah Seto and Moncarol Wang
Funding for public schools is not enough to support all the services and activities that school districts wish to provide to the community. In June 1978, California voters passed Proposition 13 tax reform which rolled back property tax value, freezing it at the 1976 assessed value level. Property tax increases were limited to no more than 2% per year. While this legislation benefited property owners, it greatly hurt the public school system whose main source of funding was property tax. In the first year after Proposition 13, property tax collections decreased 52%. The average real-estate tax rate today in California is 60% lower than the rate in 1978. The most populous state in the nation now ranks 28th in state and property tax collections.
Parents, however, were not going to let their children’s education be put at risk so they created local education foundations to raise additional funds for their school districts. Both the Redwood City Education Foundation and the San Carlos Education Foundation were founded in the early 1980’s in response to the Proposition 13 legislation.
The San Carlos School District is a Revenue Limit District which means that it receives the bulk of its funding from the state. For the 2012-2013 school year, San Carlos received $9,517 per student. For comparison, nearby Woodside received $20,070, Menlo Park $10,911, and Hillsborough $14, 465. The San Carlos Education Foundation (SCEF) serves four elementary schools, two middle schools, and a learning center which collectively serve over 3,000 students. The foundation’s priorities include reducing class size, providing library and literary specialists, funding physical education, music, and art classes, and funding teacher development.
In its first year, SCEF raised about $30,000. Today, it raises more than $2 million annually to close the gap in public funding. SCEF holds one major fundraising event a year, called Spring Fling. Spring Fling is comprised of a dinner, dance, and auction, and it raises over $500,000. To spread awareness about events like the Spring Fling and other fundraising campaigns, SCEF utilizes postal mail and email, although postal mail is more effective in acquiring support and participation. According to Kate Wormington, former SCEF Executive Member, many parents in the community are growing weary of reaching into their pockets to support programs that they feel the state should fund. Many of these parents compare the current situation to the way things were when they themselves were school-aged children and cannot help but become discouraged.
SCEF not only receives funding through parent contributions, but also through corporate donations. Through multiple incentives from ‘thank you’ ads in newspapers to advertisement on campuses, SCEF is able to reach out to multiple parties who have money. Each donation of at least $100 puts the business’s name into at least 2,500 households. With this system in place, both SCEF and its corporate donors gain something. This year, SCEF has set a goal of $500,000 for the business community to donate.
SCEF is a non-profit organization that is run by volunteers. There is a board of directors that leads the organization, and there are representatives from each of the seven schools on the board. The organization gifts its funds to the San Carlos School District with its list of recommendations on where funding should go based on its conversations with schools, PTAs, and parents. Although these funds are asked to be allocated toward certain aspects of the school, the final decision rests with the San Carlos School District.
As California moves itself slowly out of the recession and in the wake of years of budget cuts to education, organizations like SCEF have played an integral part in keeping the education system together. Through the work of volunteers and the contributions of parents and business, school districts can still thrive. The San Carlos School District is ranked in the top 6% in the nation thanks to organizations like SCEF which help close the gap brought on by lack of funds and make the district competitive at the state level. It is important that people support organizations which close the gap created by lack of funding to ensure that children receive the education they deserve.
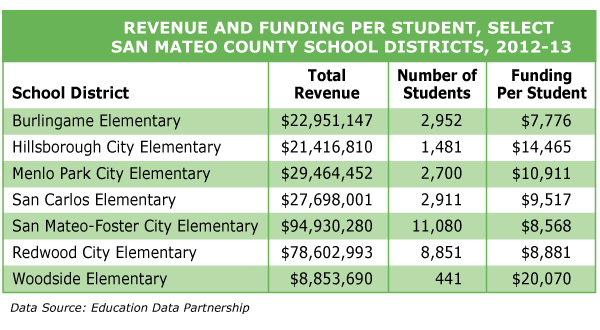
This data table of 2012-2013 data shows that the funding school districts receive is not proportional based on the number of students. While the San Carlos School District receives $9,517 per student, the Woodside School District for example receives $20,070 per student.
The San Carlos Education Foundation which serves 3,297 students raised $2.2 million last year, which amounts to $667.27 per student.
(jump to top of page)
The Inequality Cycle
By: Sandra Shu and Alexandria Wheeler
As the income distribution between the wealthy and less fortunate has become less equitable, a higher percentage of Americans are falling into the low income category. The discouraging signs of economic instability can be traced to the differences in education that children receive. Educational differences have become one of the key components in economic inequality and in limiting economic mobility. Those who attend a university or college are more likely to earn higher wages in the future than those who do not go on to higher education. Since parents are a strong influence on their children’s educational aspirations, children are likely to remain a part of the same economic strata as their parents.
In order to see the link that family income and education levels have on the academic success of high school students in San Mateo County, we created a survey for students at a local high school. The students answered a variety of questions about their academic course load, their parents’ levels of academic attainment, and their future plans for college. Based on three descriptions, the students selected their family’s “perceived income level,” which we categorized later as low, medium, and high.
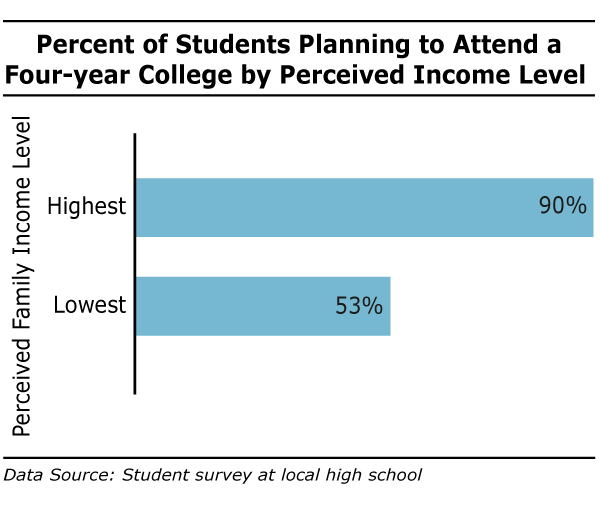
- 81% of overall respondents plan to attend a four-year university, but the results differ by perceived income level.
- About half of those at the lowest income level plan to attend a four-year college, compared to 90% from the highest perceived income level.
- The majority of respondents, around 60%, describe their families as middle income.
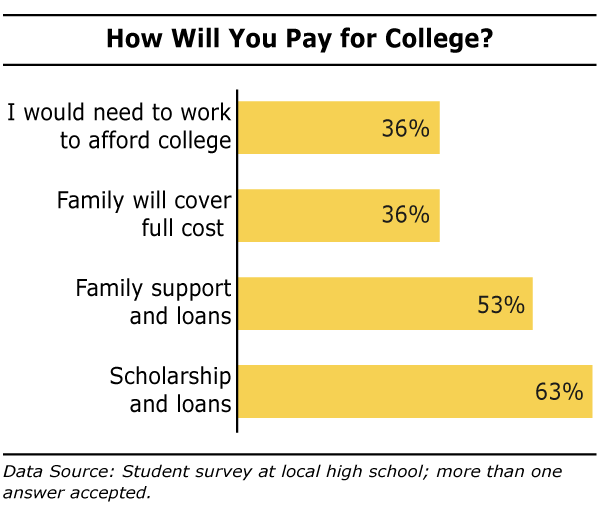
- Most students are planning to take out loans to fund their college education, either as a combination of scholarships and loans (63%) or a combination of family support and loans (53%).
In order to remove the barrier that separates students who choose to attend college from those who choose not to attend college, parents and families must provide a positive outlook on education for children. Motivating them to perform well in school and to strive for education past high school is crucial to leveling out the sharp difference in income levels within the United States. Though the research was based on one high school in San Mateo County, the correlation between family income and high school students’ college aspirations holds true on a larger scale, whether it be at the state level or the entire country. Creating a skilled, educated workforce is the key to solving the country’s high levels of economic inequality.
(jump to top of page)
Income Inequality by Race
By: Jason Zhang
As highlighted in President Barack Obama’s 2014 State of the Union Address, income inequality remains a pressing issue for the United States. President Obama realizes that despite the upward trend in the economy in the past year, economic mobility has been unable to keep pace with the rate of recovery. While income inequality has not often been the theme of presidential addresses throughout the years, it is certainly not a new problem.
Income inequality has plagued the United States for decades, and a big part of the issue is the “Race Gap.” Income inequality by race has persisted through numerous business cycles, and the recent 2008 recession was no exception. Ever since their incomes were recorded in the late 1980’s, Asian Americans have been at the top of the income charts, always maintaining an average income of over $60,000 and reaching $68,636 in 2012. Second in the income rankings were non-Hispanic whites with an average income of $57,009 in 2012. Far below the nationwide income average of $51,017 are Hispanics and African Americans who averaged $39,005 and $33,321, respectively.
While San Mateo County has sustained a higher average income and a lower unemployment rate when compared to the rest of the nation, the Race Gap still exists. Asian Americans and whites have consistently higher incomes than Hispanics and African Americans. Between 2008 and 2009, when the Great Recession was at its peak, the average income for African Americans in San Mateo County dropped from $60,726 to $49,843 while that of Asian Americans actually rose from $95,484 to $103,746. Granted, the data for African Americans is prone to higher fluctuations due to the fact that they only make up 3% of the county’s population, but the trend holds true on a national level ” income for Hispanics and African Americans had sharper declines during the recession than income for Asian Americans and whites. Likewise, in the subsequent years, Asian Americans and whites have seen their incomes quickly rise and readjust to pre-recession levels; on the other hand, the incomes of Hispanics and African Americans have not rebounded as quickly.
With midterm elections soon approaching, politicians are paying more attention to income inequality. Democrats and Republicans have fundamentally different views when economic policy is involved, but it is a good sign that both parties acknowledge income inequality as an issue to address in their campaign platforms. One possible solution that has sparked debate is President Obama’s proposal to raise the minimum wage from $7.25 to $10.10. Such an increase would benefit low-income workers, but Republicans argue that it would bring serious unintended consequences. Representative Paul Ryan of Wisconsin is staunchly opposed to the idea, claiming that government action to increase wages would needlessly raise the cost of production for manufacturers and backfire on the economy. Another of President Obama’s proposals, however, seems to provide a less controversial remedy to the issue. The President outlined education reform as a long-term solution to income inequality because those who have a college degree are almost certain to have higher incomes than those who do not. On an aggregate level, this claim has proven to be true. With Asian parents’ emphasis on education, a greater percentage of Asian Americans have graduated from college than any other race. That Asian Americans also earn the highest average income in the nation is no coincidence and allows us to come to a conclusion ” education is an important key to solving income inequality.
(jump to top of page)
The California Homes and Jobs Act
By: Julia Li and Jiaweh He
In 2013, State Senator Mark DeSaulnier (D-Concord) introduced Senate Bill 391, also known as the California Homes and Jobs Act, to build affordable homes and create more jobs for Californians.
In the wake of the foreclosure crisis, many Californians are struggling with housing costs. With increased numbers of renters and a short supply of rental housing, rents have reached new highs. Working families require affordable housing, and their ability to maintain housing is affected by their jobs and salary. In turn, California’s business competitiveness is propelled by the working population, and a lack of affordable housing can impede business development. Prior to their dissolution in 2011, Redevelopment Agencies in California gave one-fifth of their annual revenue (approximately $1 billion) to affordable housing. Without redevelopment funds, there has been almost no state investment in affordable housing.
The California Homes and Jobs Act would create a $75 document recording fee for real estate transactions (excludes home sales). This fee is estimated to generate $500 million annually for the state. This money could be leveraged to get additional federal money, local funds, and bank loans to build more affordable housing. SB 391 has been approved by the state senate and is awaiting action by the Assembly Appropriations Committee in August 2014.
The California Homes and Jobs Act is projected to create 29,000 jobs annually in the construction sector through the creation of new homes. Most importantly, the bill would build safe and affordable apartments and single-family homes to residents of California who demonstrate a certain need, including seniors and veterans, people with disabilities, families, and those who have been or are currently homeless. Proponents of the bill argue that with more housing available, the state would be able to attract new residents who are willing to work and stay at businesses in an area where rent and mortgage is within reach.
The list of supporters of the California Homes and Jobs Act includes groups connected to law enforcement and public safety, veterans and seniors, environment and transportation advocates, business, community groups, and others. Specific examples include the Bay Area Council, United States Veterans Initiative (U.S. VETS), Bay Area Rapid Transit (BART), and the City of San Mateo.
Opponents of the California Homes and Jobs Act claim the bill will not only be ineffective, but will also place a heavy financial burden with its new tax. The County Recorders Association of California opposes the bill mainly due to the recording fee that would be introduced as a funding mechanism for affordable housing. The Ventura County Taxpayers Association points out that the bill only affects those performing real estate transactions and excludes home sales, thus targeting a very small portion of the population despite trying to fix the larger community issue of affordable housing. By imposing the fee per document, the total cost per transaction will add up to hundreds of dollars. Some argue that the legislation has strayed from the original purpose of financing affordable housing locally to one of targeting new property owners to increase revenue which is sent to the State to be redistributed.
Though the California Homes and Jobs Act proposes a way to attract federal funding and increase affordable housing and jobs, the process for acquiring funds and determining who and which transactions require fees needs to be transparent for the bill to succeed.
(jump to top of page)
Comparing California’s Poverty Measure to the U.S. Official Poverty Measure
By: Rachel Ng and Tiffany Chen
The California Poverty Measure (CPM) developed by the Stanford Center on Poverty and Inequality, is a new way of determining the poverty rate for California. Unlike the Official Poverty Measure (OPM), the CPM creates a more comprehensive picture of poverty levels. The CPM includes cash and in kind transfers, calculated from after-tax income, and it includes medical, child care, work expenses, and consumer expenditures. It is also adjusted to include a broader definition of ‘family’ so that unmarried partners, foster children, and others are accounted for, and it calculates living costs based on geographic locations. For the Bay Area Counties, the CPM estimates a greater poverty rate than that provided by the OPM because living costs in urban counties are much higher. In general, the CPM shows higher poverty rates in California and in urban areas than the OPM.

- In the Mateo County, CPM shows a poverty level almost twice as high as the OPM.
- Overall, the CPM estimation of poverty in California is 3.8% higher than that of the OPM.
- The greatest difference between the CPM and OPM occurs in San Mateo, Napa, San Francisco*, and Marin.
* San Francisco’s minimum wage is $10.74 per hour ($3.49 more than federal min. wage), but it is still not enough to stop the increase in poverty rates in the city due to rising housing costs. Rising poverty is correlated to the increasing gap between the wealthy and the poor. The cost of living in San Francisco is high, which is why, despite a high minimum wage, in comparison to the nation, poverty continues to rise.
Recent bus riots show the increasing dissatisfaction over the rising prices for housing in San Francisco, especially along the routes of the private shuttles. Big companies like Google and Facebook have been using city public bus stops which protesters claim are creating traffic problems and driving up the price of housing. Protestors demand the companies contribute money to affordable housing to offset increased housing costs. An increase in costs of living leads to increasing poverty rates.
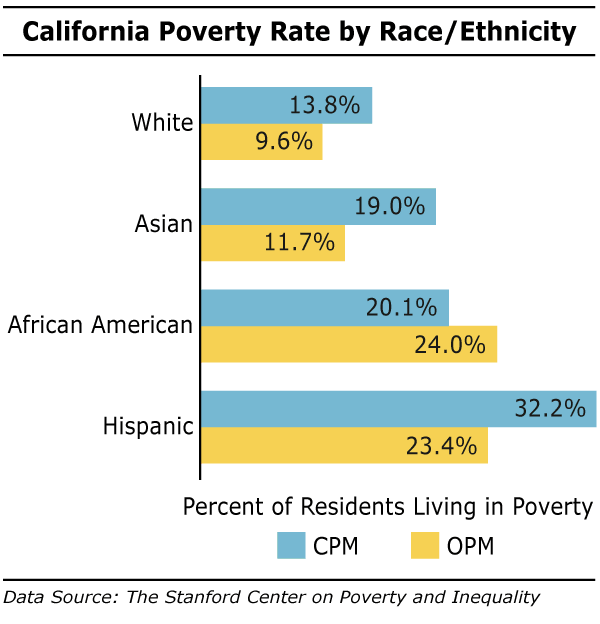
- Poverty rates for Hispanic-Latinos and African Americans are higher than for any other ethnic group. For all ethnic groups except African American, the CPM predicted a higher rate of poverty than the OPM did. This is in part due to a lack of access to adequate medical care and an imbalance in education between well-off cities and rural ones.
- The biggest difference of 8.8 occurs for Hispanics where the OPM predicted a poverty rate of 23.4 and the CPM predicted a poverty rate of 32.2. The second biggest difference occurs for Asians with a difference of 7.3.
- The only ethnic group that did not have increased poverty rates predicted by the CPM were African Americans. The OPM predicted a poverty rate that is 3.9% higher for this group.