

Most of our community knows about some of the work we do, but do you know the impact all of our core programs are having? This month, we shared a behind-the-scenes look at how SSMC creates our core programs and how they help make San Mateo County more sustainable for everyone. Take a look at each of our profiles:
- Sustainability Dashboard – keep reading below
- Indicators Report
- Ideas Bank
- Annual Awards Celebration
Like what you see? Thousands of hours of work go into our core programs, which help to make San Mateo County more sustainable and hold our cities accountable. As an independent 501(c)(3) organization, we rely on donors like you to sustain our work. Your donation–big or small–makes a significant difference to a local organization like SSMC.
Special event! Donors who set up a recurring monthly donation of at least $20 per month will receive an invitation to our fabulous end-of-year donor appreciation event. We’ve arranged for a very special treat for donors at this event. More to come, but we known you’re going to love it! See our Instagram account and sign up for our newsletter to get all the updates!
Warm regards,
Sarah Hubbard
Executive Director
Sustainable San Mateo County
The Sustainability Dashboard
Do you know which city in San Mateo County consumes the most natural gas per capita? Which cities are building the most affordable housing? Which city will likely have the most annual economic loss from coastal flooding?
You can find those answers and learn much more about how your city is performing by checking out our new Sustainability Dashboard. This unique data platform for San Mateo County integrates and organizes sustainability data from over 30 sources, tracks progress across cities and over time and holds our cities accountable for sustainability.
The Dashboard is used by city officials, city staff, community organizations and individual advocates for planning, policy making, grant writing, resource allocation, building a culture of sustainability and mobilizing community action. But what goes into building it?

Behind-the-Scenes
A year-long process and over 1,000 hours to:
- Identify the most important data through almost 100 interviews with city and community leaders and subject matter experts
- Scrutinize hundreds of possible metrics and primary data sources.
- Finalize metrics that can be compared across cities and over time.
- Build the database and customize the data visualization tool.
Impact
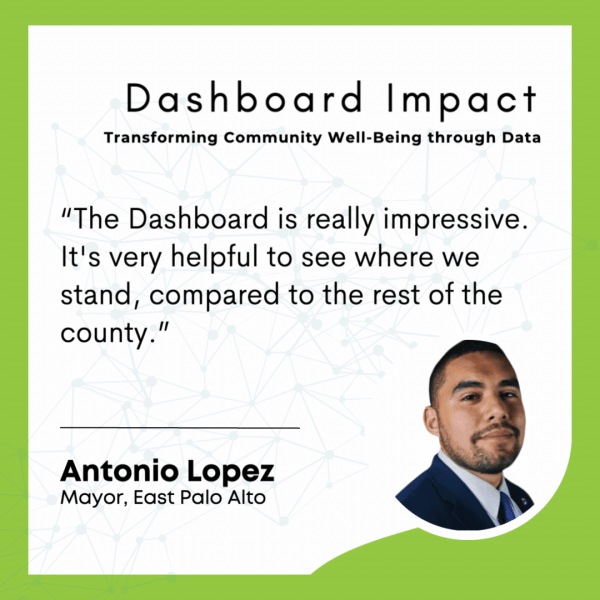
- In preview sessions this summer, 12 cities reviewed data with SSMC, and together we’ve prioritized six critical areas of sustainability to focus on.
- Decision-makers and policymakers are already using it and praising it!
- The new dashboard had thousands of views, before its official launch this month.
What’s Next
The dashboard needs frequent updating to keep up with the fast-paced change of sustainability progress and knowledge.
- Incorporate the latest data and add new metrics.
- Create comprehensive city views
- Evaluate offering the data for cities to display on their own websites.
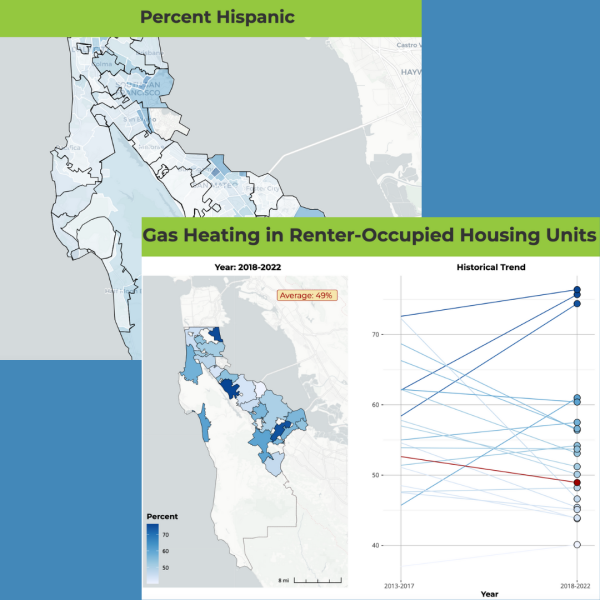
- Add demographic and census-tract data to allow decision-makers to prioritize where improvements are most needed
- Package the data for cities to display on their own websites.
We need your support to offer the Dashboard, hold our cities accountable and make San Mateo County sustainable for everyone. Remember, if you set up a recurring donation of at least $20/month, you will receive an invitation to our end-of-year donor appreciation event. For hints about the event, see our Instagram account or sign up for our newsletter.
If you missed our Sustainability Dashboard launch event including experts from health, housing and climate discussing the role of data in policy making, and a review of the top use cases for the Dashboard, view the event recording here and see highlights on our Instagram account.
Our series continues with a behind-the-scenes tour of the Indicators Report! Click here to continue.
